|
Hint: If the map does not fit on your monitor try "full screen mode", which is toggled
with the F11 key.
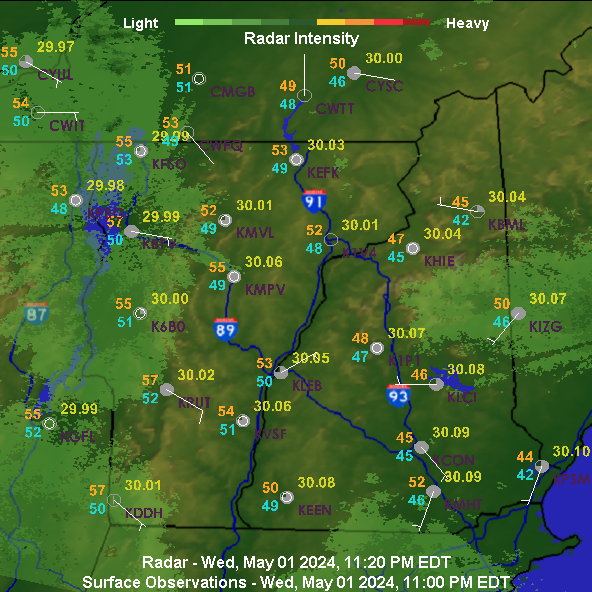
Regional Surface Observations
Our surface map includes traditional surface observations and radar observations from
the National Weather Service (NWS). Surface observations are obtained at the top of each
hour, and radar observations are available every 6 minutes. The map is plotted 20
minutes after each hour to make sure that all data have been received.
Radar observations are from all NWS sites covering the region, and indicate the intensity of precipitation
(see scale) and not the type of precipitation.
Surface observations are shown for NWS stations, and are plotted around the station
location in a regular manner.
The city name will appear when the mouse rolls over the station id.
The temperature and dew point are in degrees Fahrenheit; the air pressure is in inches
of mercury; the cloud cover shows the fraction of the sky covered with clouds. Wind
speed is in knots.
Common weather codes are: F - fog, R - rain, S - snow, Z - ice, "-" - light, "+" - heavy.
Wind direction is indicated by the shaft approaching the station location. A shaft
from the top indicates a wind from the north. Wind speed is shown by the "feathers"
on the shaft. Add 5 for a half line to 10 for each full line.
|