
|
|
|
Please note:
- Charts on the Normals, Trends, and Global Climate tool pages are created with
Google Chart Tools.
- To view these pages correctly, you must have
javaScript enabled.
- These pages may load very slowly in Internet Explorer 8 and earlier versions.
|
|
Weather data for Saint Johnsbury, VT has been recorded at the Fairbanks Museum
every day since the end of 1894. Averages are routinely computed for each month,
and are summarized on this page. All data on this page are monthly averages;
daily averages and records are on the Normals and Extremes page.
This page is updated twice a year - after the end of June and December.
|
Mean Values for each Month
|
|
|
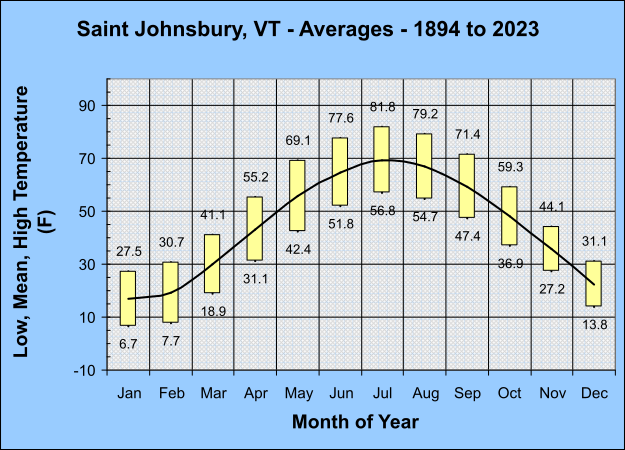
The Averages chart (immediately above) shows the average high and low temperatures
for each month as a vertical yellow bar. The average mean temperature for each month
is shown as a black curve.
|
|
|
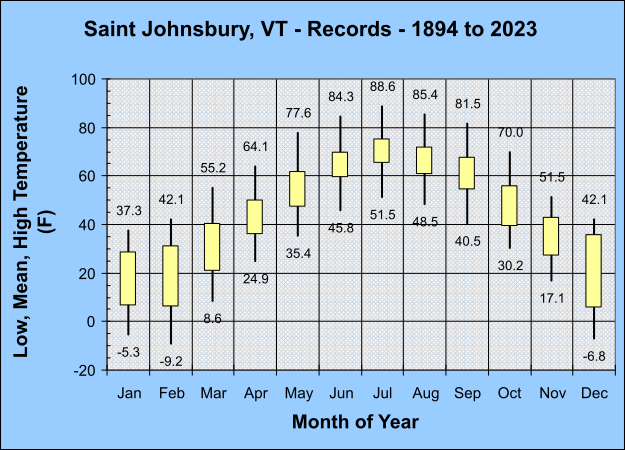
The Records chart (immediately above) shows the warmest and coolest mean
temperature for each month as a vertical yellow bar. The warmest high temperature and
the coolest low temperature for each month are shown as a black vertical bar.
|
| | Jan | Feb | Mar | Apr | May | Jun | Jul | Aug | Sep | Oct | Nov | Dec | | Year | |
| Warmest (°F) | 37.3 | 42.1 | 55.2 | 64.1 | 77.6 | 84.3 | 88.6 | 85.4 | 81.5 | 70.0 | 51.5 | 42.1 | | | |
| (°C) | 2.9 | 5.6 | 12.9 | 17.8 | 25.3 | 29.1 | 31.4 | 29.7 | 27.5 | 21.1 | 10.8 | 5.6 | | | |
| Year | 1933 | 1981 | 1946 | 1921 | 2015 | 1919 | 1921 | 1944 | 1961 | 1947 | 1948 | 2015 | | | |
| Average (°F) | 27.5 | 30.7 | 41.1 | 55.2 | 69.1 | 77.6 | 81.8 | 79.2 | 71.4 | 59.3 | 44.1 | 31.1 | | 55.7 | |
| (°C) | -2.5 | -0.7 | 5.1 | 12.9 | 20.6 | 25.3 | 27.7 | 26.2 | 21.9 | 15.2 | 6.7 | -0.5 | | 13.2 | |
| Coolest (°F) | 17.4 | 20.6 | 32.2 | 45.7 | 57.4 | 70.9 | 76.1 | 72.3 | 65.7 | 47.9 | 36.6 | 17.8 | | | |
| (°C) | -8.1 | -6.3 | 0.1 | 7.6 | 14.1 | 21.6 | 24.5 | 22.4 | 18.7 | 8.8 | 2.6 | -7.9 | | | |
| Year | 1904 | 2015 | 1896 | 1926 | 1917 | 1897 | 2009 | 1903 | 1896 | 1925 | 1901 | 1989 | | | |
| Warmest (°F) | 28.8 | 31.3 | 40.6 | 50.2 | 62.0 | 69.6 | 75.2 | 71.8 | 67.9 | 56.1 | 42.8 | 35.8 | | | |
| (°C) | -1.8 | -0.4 | 4.8 | 10.1 | 16.7 | 20.9 | 24.0 | 22.1 | 19.9 | 12.2 | 6.0 | 2.1 | | | |
| Year | 2023 | 1981 | 2012 | 1921 | 2015 | 2005 | 1921 | 2022 | 1961 | 2017 | 1948 | 2015 | | | |
| Average (°F) | 17.1 | 19.2 | 30.0 | 43.1 | 55.7 | 64.7 | 69.3 | 67.0 | 59.4 | 48.1 | 35.6 | 22.4 | | 44.3 | |
| (°C) | -8.3 | -7.1 | -1.1 | 6.2 | 13.1 | 18.2 | 20.7 | 19.4 | 15.2 | 8.9 | 2.0 | -5.3 | | 6.8 | |
| Coolest (°F) | 6.6 | 6.1 | 20.8 | 35.6 | 47.0 | 59.3 | 65.0 | 60.4 | 54.2 | 39.1 | 27.2 | 5.5 | | | |
| (°C) | -14.1 | -14.4 | -6.2 | 2.0 | 8.3 | 15.2 | 18.3 | 15.8 | 12.3 | 3.9 | -2.7 | -14.7 | | | |
| Year | 1970 | 1934 | 1900 | 1926 | 1917 | 1958 | 1956 | 1903 | 1950 | 1925 | 1904 | 1989 | | | |
| Warmest (°F) | 22.9 | 20.5 | 29.3 | 36.9 | 49.0 | 57.7 | 62.4 | 60.6 | 54.3 | 44.8 | 34.7 | 29.6 | | | |
| (°C) | -5.1 | -6.4 | -1.5 | 2.7 | 9.4 | 14.3 | 16.9 | 15.9 | 12.4 | 7.1 | 1.5 | -1.3 | | | |
| Year | 2023 | 1981 | 1903 | 1901 | 2011 | 2005 | 2013 | 2021 | 1961 | 2023 | 2006 | 2015 | | | |
| Average (°F) | 6.7 | 7.7 | 18.9 | 31.1 | 42.4 | 51.8 | 56.8 | 54.7 | 47.4 | 36.9 | 27.2 | 13.8 | | 32.9 | |
| (°C) | -14.1 | -13.5 | -7.3 | -0.5 | 5.8 | 11.0 | 13.8 | 12.6 | 8.6 | 2.7 | -2.7 | -10.1 | | 0.5 | |
| Coolest (°F) | -5.3 | -9.2 | 8.6 | 24.9 | 35.4 | 45.8 | 51.5 | 48.5 | 40.5 | 30.2 | 17.1 | -6.8 | | | |
| (°C) | -20.7 | -22.9 | -13.0 | -3.9 | 1.9 | 7.7 | 10.8 | 9.2 | 4.7 | -1.0 | -8.3 | -21.6 | | | |
| Year | 1970 | 1934 | 2014 | 1911 | 1967 | 1927 | 1965 | 1903 | 1963 | 1974 | 1904 | 1989 | | | |
|
|
The High, Mean, and Low Temperature tables (immediately above) show the
temperture values in Fahrenheit and the year that the warmest and coolest values occured.
The average values have a colored background, while values in Celcius have a gray background.
|
|
|
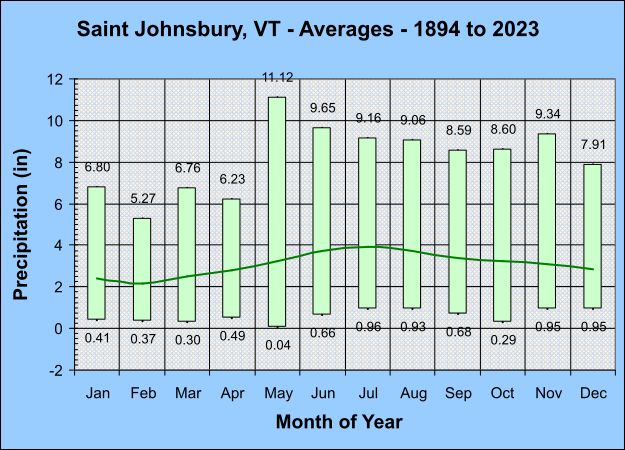
The Average Precipitation chart (immediately above) shows the highest and lowest
precipitation for each month as a vertical light green bar. The average precipitation
for each month is shown as a dark green curve.
Precipitation includes rain, as well as the water content of snow and frozen precipitation
that falls (known as "melted precipitation").
|
|
|
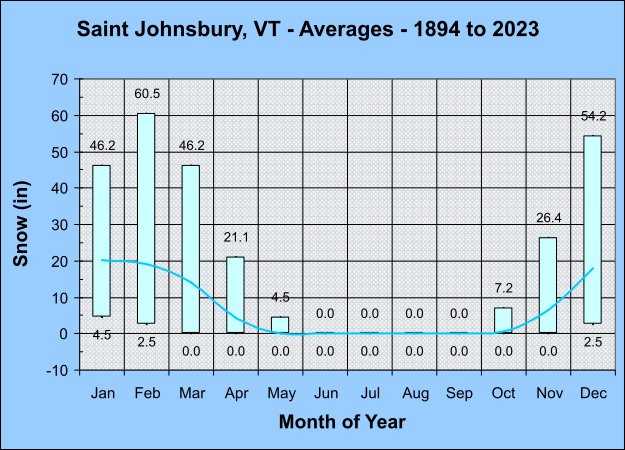
The Average Snow chart (immediately above) shows the highest and lowest
snow for each month as a vertical light blue bar. The average snow
for each month is shown as a medium blue curve.
Snowfall is measured three times per day (7 AM, Noon, and 4 PM) on a special solid level surface.
After measuring snowfall, the surface is swept clean. Values for every day are determined by
summing the 3 measurements. This is different from the depth of snow on the ground, which is
affected by melting, compaction, and other natural effects.
|
| | Jan | Feb | Mar | Apr | May | Jun | Jul | Aug | Sep | Oct | Nov | Dec | | Year | |
| Most (in) | 6.80 | 5.27 | 6.76 | 6.23 | 11.12 | 9.65 | 9.16 | 9.06 | 8.59 | 8.60 | 9.34 | 7.91 | | | |
| (mm) | 173 | 134 | 172 | 158 | 282 | 245 | 233 | 230 | 218 | 218 | 237 | 201 | | | |
| Year | 1979 | 2008 | 1913 | 2000 | 2011 | 1973 | 2008 | 2011 | 1999 | 2005 | 1927 | 1973 | | | |
| Average(in) | 2.39 | 2.15 | 2.49 | 2.80 | 3.25 | 3.73 | 3.92 | 3.75 | 3.39 | 3.24 | 3.08 | 2.84 | | 37.03 | |
| (mm) | 61 | 55 | 63 | 71 | 83 | 95 | 100 | 95 | 86 | 82 | 78 | 72 | | 941 | |
| Least (in) | 0.41 | 0.37 | 0.30 | 0.49 | 0.04 | 0.66 | 0.96 | 0.93 | 0.68 | 0.29 | 0.95 | 0.95 | | | |
| (mm) | 10 | 9 | 8 | 12 | 1 | 17 | 24 | 24 | 17 | 7 | 24 | 24 | | | |
| Year | 1981 | 1987 | 1915 | 1941 | 1903 | 1936 | 1919 | 2002 | 1908 | 1924 | 1922 | 1896 | | | |
| Most (in) | 46.2 | 60.5 | 46.2 | 21.1 | 4.5 | 0.0 | 0.0 | 0.0 | T | 7.2 | 26.4 | 54.2 | | | |
| (cm) | 117.3 | 153.7 | 117.3 | 53.6 | 11.4 | 0.0 | 0.0 | 0.0 | T | 18.3 | 67.1 | 137.7 | | | |
| Year | 1954 | 1969 | 1956 | 2007 | 1917 | | | | 1992 | 1952 | 1921 | 2007 | | | |
| Average(in) | 20.3 | 19.0 | 14.1 | 4.4 | 0.1 | 0.0 | 0.0 | 0.0 | 0.0 | 0.5 | 6.5 | 18.0 | | 83.0 | |
| (cm) | 51.6 | 48.3 | 35.8 | 11.2 | 0.3 | 0.0 | 0.0 | 0.0 | 0.0 | 1.3 | 16.6 | 45.7 | | 210.8 | |
| Least (in) | 4.5 | 2.5 | T | T | T | 0.0 | 0.0 | 0.0 | T | T | T | 2.5 | | | |
| (cm) | 11.4 | 6.4 | T | T | T | 0.0 | 0.0 | 0.0 | T | T | T | 6.4 | | | |
| Year | 1980 | 1941 | 1946 | 2009 | 2019 | | | | 1992 | 2016 | 1973 | 1895 | | | |
|
|
The Precipitation and Snow tables (immediately above) show the
values in Inches and the year that the most and least values occured.
The average values have a colored background, while values in metric units have a gray background.
|
| | Jan | Feb | Mar | Apr | May | Jun | Jul | Aug | Sep | Oct | Nov | Dec | | Year | |
| Most (°F) | 1804 | 1644 | 1362 | 876 | 552 | 187 | 66 | 152 | 319 | 795 | 1125 | 1836 | | | |
| (°C) | 1002 | 913 | 757 | 487 | 307 | 104 | 37 | 84 | 177 | 442 | 625 | 1020 | | | |
| Year | 1970 | 1934 | 1900 | 1926 | 1917 | 1927 | 1912 | 1903 | 1950 | 1925 | 1904 | 1989 | | | |
| Average (°F) | 1477 | 1286 | 1079 | 650 | 298 | 84 | 20 | 47 | 195 | 520 | 874 | 1313 | | 7843 | |
| (°C) | 821 | 714 | 599 | 361 | 166 | 47 | 11 | 26 | 108 | 289 | 486 | 729 | | 4357 | |
| Least (°F) | 1122 | 937 | 764 | 438 | 116 | 23 | 0 | 1 | 77 | 282 | 659 | 904 | | | |
| (°C) | 623 | 521 | 424 | 243 | 64 | 13 | 0 | 1 | 43 | 157 | 366 | 502 | | | |
| Year | 2023 | 1981 | 1946 | 1921 | 1998 | 1895 | 2011 | 1939 | 1934 | 2017 | 1948 | 2015 | | | |
| Most (°F) | 0 | 0 | 0 | 16 | 78 | 194 | 327 | 222 | 174 | 15 | 4 | 0 | | | |
| (°C) | 0 | 0 | 0 | 9 | 43 | 108 | 182 | 123 | 97 | 8 | 2 | 0 | | | |
| Year | | | | 1941 | 1911 | 1919 | 1921 | 1937 | 1961 | 1954 | 2022 | | | | |
| Average (°F) | 0 | 0 | 0 | 1 | 18 | 82 | 160 | 115 | 35 | 2 | 0 | 0 | | 412 | |
| (°C) | 0 | 0 | 0 | 1 | 10 | 46 | 89 | 64 | 19 | 1 | 0 | 0 | | 229 | |
| Least (°F) | 0 | 0 | 0 | 0 | 0 | 11 | 61 | 18 | 1 | 0 | 0 | 0 | | | |
| (°C) | 0 | 0 | 0 | 0 | 0 | 6 | 34 | 10 | 1 | 0 | 0 | 0 | | | |
| Year | | | | | | 1958 | 1965 | 1903 | 1938 | | | | | | |
| Most (°F) | 10 | 4 | 46 | 127 | 396 | 592 | 790 | 681 | 545 | 212 | 41 | 8 | | | |
| (°C) | 6 | 2 | 26 | 71 | 220 | 329 | 439 | 378 | 303 | 118 | 23 | 4 | | | |
| Year | 1995 | 1981 | 2012 | 1910 | 1911 | 2005 | 1921 | 1937 | 1961 | 2017 | 1927 | 1934 | | | |
| Average (°F) | 0 | 0 | 3 | 37 | 217 | 448 | 605 | 533 | 301 | 82 | 8 | 0 | | 2234 | |
| (°C) | 0 | 0 | 2 | 21 | 121 | 249 | 336 | 296 | 167 | 46 | 4 | 0 | | 1241 | |
| Least (°F) | 0 | 0 | 0 | 0 | 32 | 288 | 472 | 331 | 178 | 6 | 0 | 0 | | | |
| (°C) | 0 | 0 | 0 | 0 | 18 | 160 | 262 | 184 | 99 | 3 | 0 | 0 | | | |
| Year | | | | | 1917 | 1958 | 1956 | 1903 | 1950 | 1981 | | | | | |
|
|
The Degree Day tables (immediately above) show the
values in Fahrenheit and the year that the most and least values occured.
The average values have a colored background, while values in metric units have a gray background.
Heating, Cooling, and Growing degree days are similar in that they measure the difference between
the mean daily temperature and a standard value. The standard value for heating and cooling
degree days is 65 F, and the value for growing degree days is 50 F.
Heating degree days are calculated by subtracting the mean temperature from 65 when the
mean temperature is below 65, and set to 0 when the mean temperture is above 65. They are often
used to determine the energy required to heat a building, and are widely used by home energy
providers to schedule fuel delivery. They can be used to understand a homes energy use -
its efficiency and year to year comparisons.
Cooling degree days are calculated by subtracting 65 from the mean temperature when the
mean temperature is above 65, and set to 0 when the mean temperture is below 65. They are often
used to determine the energy required to cool a building, and are widely used by utility
companies that provide electricity.
Growing degree days are calculated by subtracting 50 from the mean temperature when the
mean temperature is above 50, and set to 0 when the mean temperture is below 50. They are often
used in agriculture and horticulture to estimate growth of plants and crops, blossoming of fruit,
as well as development of pests and weeds.
|